
Happy Birthday Excel!
![]()
I would posit that the world’s most used data science software is the ubiquitous Microsoft Excel. Released for Windows in November 1987, this month marks its 30th anniversary. In that time I’d imagine it has been employed by all manner of people across near all industries: from the fund manager tracking his multi-million dollar portfolios to the young couple managing their family budget. There’s a reason why Excel has proved to be so popular: it’s actually very good!
Sometimes I sense an element of snobbishness from data professionals when it comes to Excel. I get the distinct feeling that some look down their nose at it, as if it ought to be left behind in the accelerating race between competing analytical tools. However, for a lot of users this software contains all the functionality they will ever require, with its spreadsheet format making life particularly simple to inspect data sets and perform manipulations.
Now before Bill Gates sends me an honourary membership of the Excel Fan Club there are clearly situations where it falls short. One of these for me is in its graphics capabilities: often is the time I have accessed a research paper only to see Excel graphs included, and my expectations of the work contained within is immediately diminshed (see, I can be snobbish too!). I am told that Excel does not scale well within large organisations, although I admit to never being in a position to either support or challenge this. A third, and potentially very serious downside of Excel is its speed of execution. It was this drawback that eventually made me look for analytical alternatives some years ago, and led me to Python and in particular its pandas package.
Now Excel has many useful features and I can’t possibly hope within one blog post to show how easy it is to recreate all of them in pandas. Instead I have selected some common operations so as to give encouragement to people or organisations thinking of moving away from Excel that Python pandas will not leave them wanting.
The Pepsi Challenge
 To gather some data The Data Lab recently recreated the Pepsi Challenge. The original Challenge was a hugely successful marketing campaign started by Pepsi in the 1970s, in which they presented Joe Public with two cups – one containing Pepsi Cola and the other Coca Cola – in a blind taste test and asked them which they preferred. Pepsi then claimed that over 50% of subjects chose their cola based on taste alone.
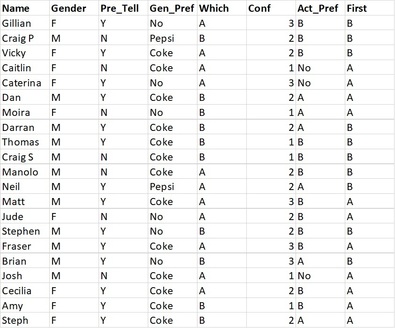
I created a simple questionnaire for the test which asked for these responses:
- Name
- Gender
- Do you think you will be able to tell which drink is Pepsi? (pre-tasting)
- In general, which drink would you say you prefer? (pre-tasting)
- Which drink is Pepsi?
- How confident are you that the one you have chosen is actually Pepsi?
- Which drink do you actually prefer?
and I also tracked which drink was tasted first by each subject.
The study results can be found here and look as below:
Replicating common Excel functionality in pandas
To get started we first load the data, noting how simple this is with the read_excel function:
import pandas as pd
import numpy as np

data = pd.read_excel(r"C:\Users\Richard\Documents\Work\Blog\Data_Team_Blog_Posts\PepsiChallenge\Pepsi Challenge Results.xlsx")
With this in memory we now focus on some of the functions that are available within pandas to allow us to understand and manipulate the data, much as we might with Excel.
Sizing the data set
Finding the number of rows of data is performed via the len function
len(data)
whilst the number of rows and columns is given by the .shape attribute
data.shape
Sorting
One very common use-case in Excel is sorting a data set. In pandas the sort_values function performs this task, allowing sorting by (possibly multiple) rows or columns, into ascending or descending order, using one of three different sorting algorithms (quicksort, mergesort, or heapsort). Sorting our data set into ascending order of subjects’ names can be done thus:
data_sorted = data.sort_values(by='Name', axis=0, ascending=True)
Filtering
Excel allows for filtering of a spreadsheet by selection via the column names. In pandas we can use so-called boolean indexing to only select the rows of the column according to some truth statements. To find all males who tasted drink A first in our test can be achieved by:
data_filtered = data[(data['Gender']=="M") & (data['First']=="A")]
Finding unique values
One simple task we may wish to perform is sanity-check the data. Suppose we wished to check that the subjects had only answered “A” or “B” to the question of which drink contained Pepsi. Then we could use the unique function
data['Which'].unique()
from which we could see that “A” and “B” are the sole responses.
Performing calculations down columns
Many times with Excel one is required to sum down columns, or maybe find average column values. Such functions are very easily applied to a pandas data frame. The average confidence score in our test results can be found via
data['Conf'].mean(axis=0)
and there are also options to determine how pandas should deal with missing values (i.e. include or ignore), a problem we do not face here.
Counting entries
Suppose we wished to know exactly how many males and females took our Challenge. Then the value_counts function applied to the Gender column tells us directly.
data['Gender'].value_counts()
As ever there is increased functionality available, such as returning sorted counts or having them normalised into percentage values.
Creating new columns
This is potentially a large topic covering lots of available options, but here I just want to show how simple it is to create a new column in our dataset showing whether the subject correctly guessed that the Pepsi was drink A.
data['Correct'] = np.where(data['Which']=="A", "Yes", "No")
Cross-tabulating
Contingency tables (also known as cross tables or cross tabulations) can give quick insights into the relative frequencies between two variables. For example, to see the joint distibution of our subjects’ preferences depending on which drink they tried first we could simply type:
data_crosstable = pd.crosstab(data['First'], data['Act_Pref'])
Pivot tables
One feature of Excel that I relied upon a lot in the past was the pivot table. This allows a tabular data set to be “re-shaped” to have different row and column indices, plus have functions applied across the resulting cells.
By now we should not be surprised to see that pandas also contains such abilities. To show the average confidence score in our test by respondants’ genders and prior preference all it takes is
data_pivot_table = data.pivot_table(values='Conf', index='Gender', columns='Gen_Pref', aggfunc=np.mean)
although again it is worth pointing out that there is much more functionality to be had than in this simple example.
Note that all the code blocks above can be found here.
Summing Up
This has been a whistle-stop tour of some of the functionality available in pandas that is commonly employed by business analysts in Excel. Whilst I have only scratched the surface what I hope to have shown is that Python pandas can easily accomplish the most-used functionality, often in single lines of code.
Although we haven’t concerned ourselves here with timing operations it should also be noted that these are performed far quicker than in Excel, particularly when acting on much larger data sets than our toy example.
To give a balanced comparison between Excel and pandas I will admit that the one great benefit to a spreadsheet is the visibility of data. Often in pandas one has to keep using data.head() to ensure that functions and manipulations have performed as expected.
Still, when considering all the pros and cons I firmly believe that Python pandas comes out a winner over Excel hands down.
Leave a Reply