
Recently, I have finished a project working on testing Machine Learning algorithm performances in different data science platforms with an explicit focus on explainability. In this post, I shall describe some of the criteria and the platforms that were used in this project. In the era of the internet where vast amounts of data are […]
Technical Skills
Exploring transport routes, journey characteristics and postcode networks using R Shiny
Hi all, Recently I’ve finished work on a project intended to visualise the traffic flow within a subsidised transport service, operated by a Scottish council. This visualisation needed to display variations in traffic flow conditional on factors such as the time of day, day of the week, journey purpose, as well as other criteria. The […]
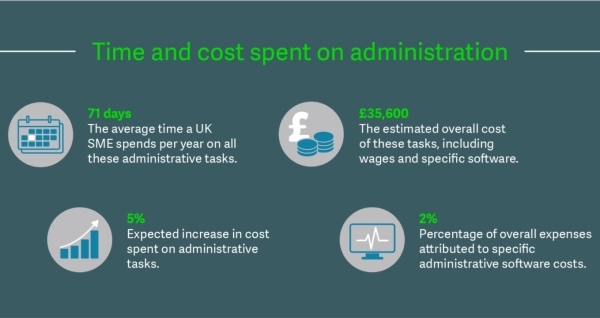
Reducing admin through digitisation
Guest blog from Sage According to a recent report from Sage, small and medium enterprises (SMEs) in the UK spend 71 days and £35,600 per year on tasks related to admin. Around 40% of SMEs are currently struggling to make administrative cost savings and roughly the same percentage would prefer to adopt technological solutions rather […]
Introducing ‘Alteryx’ as a platform for Data Science
What is Alteryx, and why should I care? This guest blog entry was inspired by Richard’s recent post in which he observed that “it is always important to keep an eye on the tools we use as data scientists and forever be on the lookout for new and better ways of doing things.” Just as Python is […]
Keeping up to date with technical advances: Python versus Tableau for data visualisations
Python is great, but… Since taking up Python several years ago I’ve often thought of it as the Swiss Army Knife of programming languages. After successfully using it for webscraping, software development, number-crunching and data visualisation one achieves a certain level of comfort in knowing that, if you need to do it in code, you […]
Running R remotely: some options and tips
Why would you need to do this? Say, for instance, you are dealing with sensitive data that should not leave a specific system, or quite simply that you are away on a work retreat – but your laptop is far less powerful than your work desktop computer which you left behind – so you want […]
Excel-like functionality with Python pandas: The Data Lab takes the Pepsi Challenge!
Happy Birthday Excel! I would posit that the world’s most used data science software is the ubiquitous Microsoft Excel. Released for Windows in November 1987, this month marks its 30th anniversary. In that time I’d imagine it has been employed by all manner of people across near all industries: from the fund manager tracking his […]
Analysis of Gaelic Station Names: An exploration of inter-language similarity measures for place-names and the design of rural scores.
Motivation Most of modern Scotland was once Gaelic-speaking and a policy change in 2010 means Gaelic names appear alongside English names on almost all station signs across Scotland’s railway. I live in Glasgow and often travel out into the highlands and over time I hypothesised: H1: The Gaelic and English names of a station become more similar […]
Snakes and Ladders (Part 3 of 3): Analysing the classic children’s game
To recap the analysis from our previous article, we have now shown that the advantage to Player 1 in snakes and ladders is minimal (amounting to less than 6 extra wins out of every 1,000 games). In this post we look at visualising some results, focusing in particular on the distribution of game lengths and the […]
Dealing with many dimensions in historical data: Tracking cooperation & conflict patterns over space and time in R
For this post, I’ve managed to find some extremely interesting historical event data offered by the Cline Center on this page. As you will see, this dataset can be quite challenging because of the sheer number of dimensions you could look at. With so many options, it becomes tricky to create visualisations with the ‘right’ level of granularity: […]